How Are Trading Indicators Made?
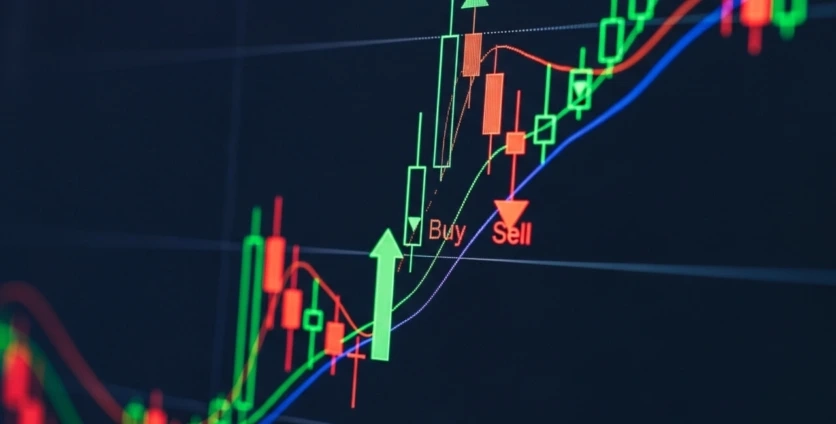
Trading indicators are the backbone of modern technical analysis, guiding everyone from day traders to institutional investors. But how are trading indicators made in the first place? Behind each popular signal—whether the Relative Strength Index (RSI), Moving Average Convergence Divergence (MACD), or Bollinger Bands—lies a blend of data science, market theory, and rigorous coding. This investigative deep dive examines how ideas become actionable tools that shape billions in global trades every day.
The Foundations of Trading Indicators
Market Theory and Mathematical Models
Every indicator begins as an idea about market behavior. Developers ask key questions: Does price momentum predict future movement? Can volume spikes signal reversals?
- Statistical concepts: Moving averages, standard deviation, and correlation provide the groundwork.
- Financial theory: The Efficient Market Hypothesis and behavioral finance influence which signals developers trust.
These hypotheses are then translated into formulas. For example, the RSI uses the ratio of average gains to losses over a set period to measure momentum.
Data Collection and Cleaning
Raw price data—from exchanges such as the NYSE or Binance—feeds the model. Accuracy is critical; any “noise” skews results. Data scientists typically:
- Pull historical price, volume, and order book data.
- Adjust for stock splits, dividends, or crypto forks.
- Use APIs like Yahoo Finance or institutional feeds such as Bloomberg Terminal to maintain integrity.
Coding and Algorithm Design
From Spreadsheet to Code
Once the math is defined, developers implement it in code, often using Python, R, or C++. The formula is embedded into trading platforms like MetaTrader or TradingView, allowing real-time calculations.
Example workflow:
- Prototype in Excel or Python.
- Optimize loops and functions for speed.
- Integrate with live feeds for immediate updates.
Open-source libraries such as TA-Lib or pandas-ta accelerate this process.
Backtesting and Optimization
Before release, an indicator undergoes backtesting: applying it to historical data to evaluate accuracy. Developers tweak parameters—like the RSI’s default 14-day period—to reduce false signals. Robust backtesting considers:
- Different market cycles (bull, bear, sideways).
- Transaction costs and slippage.
- Multiple asset classes, from equities to crypto.
Validation and Peer Review
Statistical Significance
Indicators must outperform random chance. Analysts run Monte Carlo simulations and hypothesis tests to verify predictive power. If an indicator merely fits past data without forward reliability, it’s discarded or revised.
Community Feedback
Professional traders and quantitative analysts often share early versions within private forums or academic circles. Peer feedback helps expose flaws or confirm effectiveness.
Types of Trading Indicators and Their Creation
Leading vs. Lagging
- Leading indicators (e.g., Stochastic Oscillator) aim to predict future moves.
- Lagging indicators (e.g., Moving Averages) confirm trends after they form.
Developers decide early which category their tool serves, guiding the data and formulas they prioritize.
Custom Indicators and Open Source
The rise of platforms like TradingView has democratized development. Independent coders publish indicators written in Pine Script, sharing formulas openly or selling premium versions. Many start as community experiments before becoming mainstream tools.
Security, Compliance, and Commercial Release
Before commercial use, indicator creators often protect their intellectual property with encryption or patents. Brokerages and trading software vendors may require compliance with financial regulations, ensuring the tool doesn’t mislead retail traders.
The Human Element
Despite sophisticated code, human insight remains central. Market veterans often identify inefficiencies or repeating patterns that machines alone might overlook. The collaboration between seasoned traders and data scientists creates indicators that are both innovative and practical.
FAQ: How Are Trading Indicators Made?
How are trading indicators made for stock markets specifically?
They begin with historical stock data, incorporate fundamental and technical variables, and are coded into trading platforms for real-time analysis.
How are trading indicators made reliable over time?
Through rigorous backtesting across multiple market conditions and continuous recalibration to adapt to new volatility regimes.
How are trading indicators made available to the public?
Developers release them via broker platforms, open-source repositories, or as paid plug-ins on services like TradingView.
How are trading indicators made different for crypto markets?
Crypto indicators must account for 24/7 trading, higher volatility, and unique on-chain metrics, such as wallet flows or network activity.
Forward-Looking Analysis
As machine learning and AI continue to evolve, the future of trading indicators is shifting. Developers increasingly employ neural networks and natural language processing to capture alternative data—from social sentiment to macroeconomic news feeds. Blockchain technology also enables transparent, decentralized indicator sharing, reducing reliance on proprietary black boxes.
Conclusion:
Understanding how trading indicators are made reveals that these tools are not mystical predictors but carefully engineered products of mathematics, market theory, and relentless testing. For traders and investors, appreciating the science behind indicators is the first step toward using them wisely in an increasingly complex financial landscape.

